SpringBoot – Performance Monitoring
Development - Spring Boot Performance Logging
To calculate how much time taken to execute method, with start & end time. We use AOP aspectj based interceptor to write performance logging based on time taken in method executions of aop intercepted methods.
 <dependency>
      <groupId>org.springframework.boot</groupId>
      <artifactId>spring-boot-starter-aop</artifactId>
 </dependency>
Log the method execution time using AOP for a spring boot application.
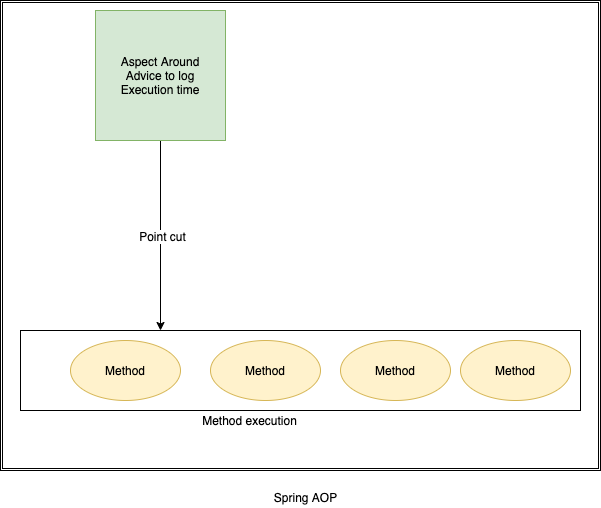
1.Create Aspect class by Implemeting Around advice
-
Create a clas and use annotation @Aspect on class to make it AOP aspect.
-
Write logic for logging inside a method & annotate with @Around to make its will before & after method execution
-
Provide packge name where the Aspect will be introduced in method calls.
-
We used StopWatch class to capture start time of method and end time of method.
-
The ProceedingJoinPoint class argument provides us the class name and method name which is going to be executed.
-
You may use enabling/disabling component with properties with ConditionalOnExpression annotation.
@Component
@Aspect
@ConditionalOnExpression("${performance.logging.aspect.active:true}")// enabled by default
public class PerformanceLoggingAspect {
	private static final Logger LOGGER = LogManager.getLogger(PerformanceLoggingAspect.class);

	  //AOP expression for which methods shall be intercepted
	  @Around("execution(* com.edc.controller..*(..)))")
	  public Object profileAllMethods(ProceedingJoinPoint proceedingJoinPoint) throws Throwable
	  {
	    MethodSignature methodSignature = (MethodSignature) proceedingJoinPoint.getSignature();

	    //Get intercepted method details
	    String className = methodSignature.getDeclaringType().getSimpleName();
	    String methodName = methodSignature.getName();

	    final StopWatch stopWatch = new StopWatch();

	    //Measure method execution time
	    stopWatch.start();
	    Object result = proceedingJoinPoint.proceed();
	    stopWatch.stop();

	    //Log method execution time
	    LOGGER.info("====> \n \n \n Execution time of " + className + "." + methodName + " :: " + stopWatch.getTotalTimeMillis() + " ms");

	    return result;
	  }
}
On executing any controller method, we can see logs with Class: method name
/testReport/all
2022-03-28 13:04:20.133  INFO 20128 --- [nio-8031-exec-3] com.edc.utils.PerformanceLoggingAspect   : ====>
Execution time of TestReportController.getAllTestReports :: 3 ms
We can enable / Disable AOP by configuring below in application.properties
logging.level.root=INFO
performance.logging.aspect.active=true
Production: SpringBoot Actuator - Health check, Auditing, Monitoring
Actuator brings production-ready features to our application. Monitoring our app, gathering metrics, understanding traffic or the state of our database.
<dependency>
    <groupId>org.springframework.boot</groupId>
    <artifactId>spring-boot-starter-actuator</artifactId>
</dependency>
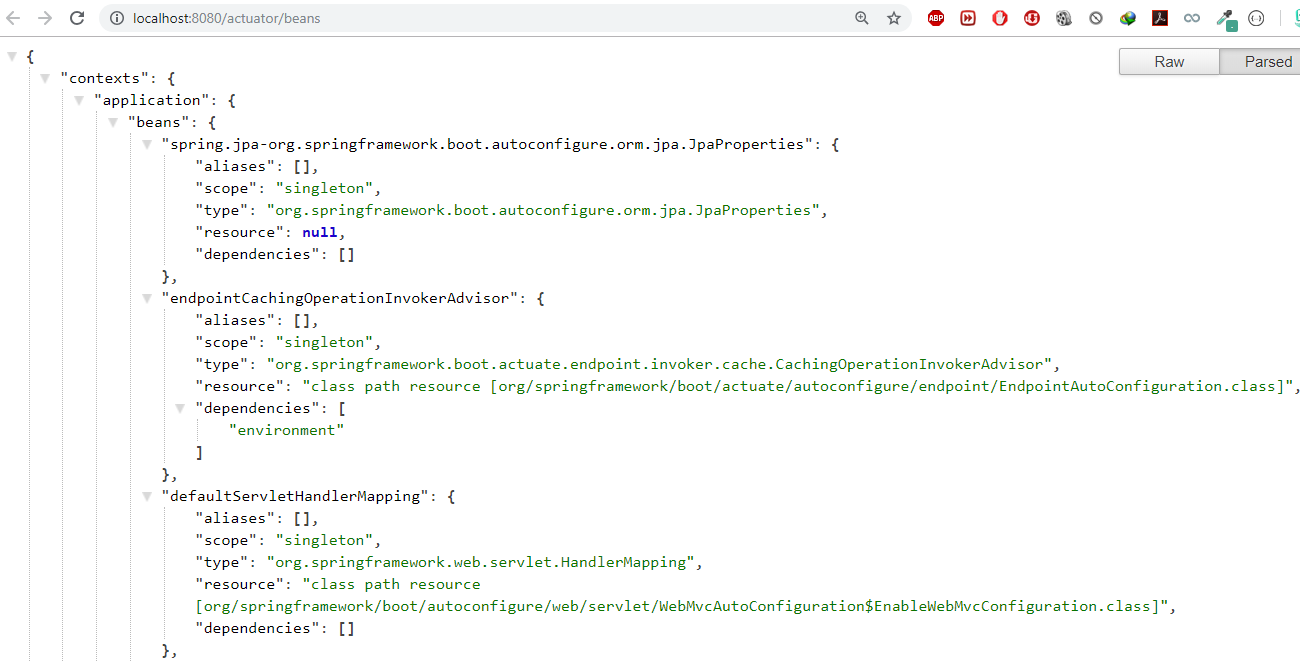
Once above maven dependency is included in the POM file, 16 different actuator REST endpoints, such as actuator, beans, dump, info, loggers, and metrics are exposed
Some of important and widely used actuator endpoints are given below:
-
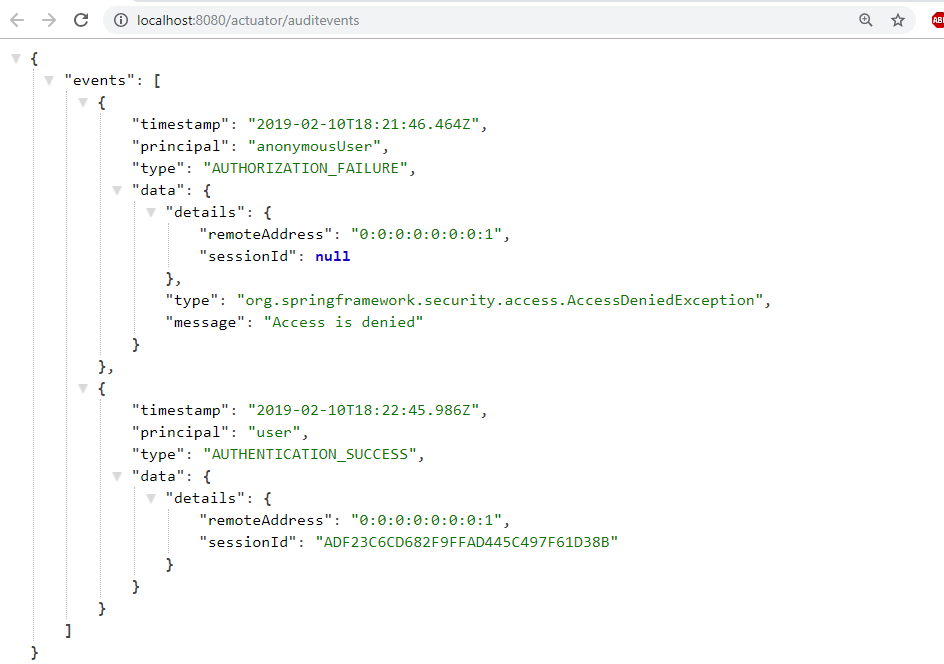
auditevents – Audit events of your application
-
info– Displays information about your application – you can customize to show version information.
-
health – application’s health status
-
metrics – various metrics information of application
-
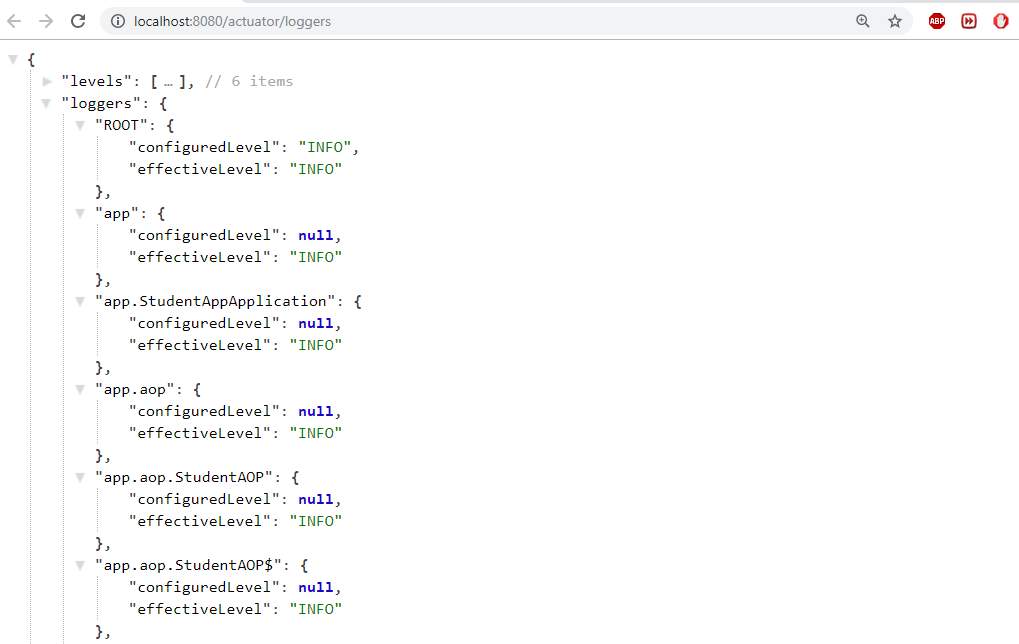
loggers – Displays and modifies configured loggers
-
logfile – Shows the contents of the log file
-
httptrace – Displays HTTP trace info for the last 100 HTTP request/response
-
env – Displays current environment information
-
flyway – Shows Flyway database migrations details
-
liquidbase – Shows details of liquibase database migrations
-
shutdown – Allows to shut down the application gracefully
-
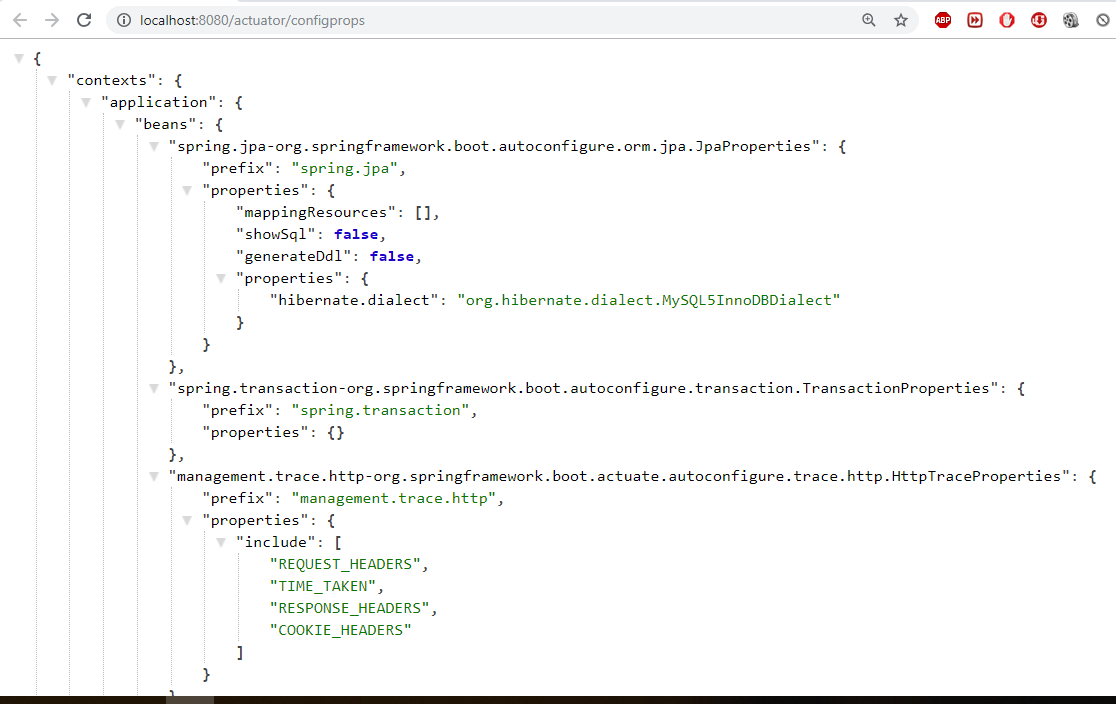
mappings– Displays a list of all @RequestMapping paths
-
scheduledtasks – Displays the scheduled tasks in the application
-
threaddump – Performs a thread dump
-
headdump – Returns JVM head dump
You can access all available endpoint by this URL: http://localhost:8080/actuator
{
	"_links": {
		"self": {
			"href": "http://localhost:8080/actuator",
			"templated": false
		},
		"health": {
			"href": "http://localhost:8080/actuator/health",
			"templated": false
		},
		"health-component-instance": {
			"href": "http://localhost:8080/actuator/health/{component}/{instance}",
			"templated": true
		},
		"health-component": {
			"href": "http://localhost:8080/actuator/health/{component}",
			"templated": true
		},
		"info": {
			"href": "http://localhost:8080/actuator/info",
			"templated": false
		}
	}
}
If you see we have only 2 endpoints showing (health, info) out of 16 endpoints
By default, all the actuator endpoints are exposed over JMX but only the health and info endpoints are exposed over HTTP.Here is how you can expose actuator endpoints over HTTP and JMX using application properties -
Exposing Actuator endpoints over HTTP
# Use "*" to expose all endpoints, or a comma-separated list to expose selected ones
management.endpoints.web.exposure.include=*
management.endpoints.web.exposure.exclude=
Exposing Actuator endpoints over JMX
# Use "*" to expose all endpoints, or a comma-separated list to expose selected ones
management.endpoints.jmx.exposure.include=*
management.endpoints.jmx.exposure.exclude=
Securing Actuator Endpoints with Spring Security
Actuator endpoints are sensitive and must be secured from unauthorized access. you can add spring security to your application using the following dependency -
<dependency>
   <groupId>org.springframework.boot</groupId>
   <artifactId>spring-boot-starter-security</artifactId>
</dependency>
we can override the default spring security configuration and define our own access rules.
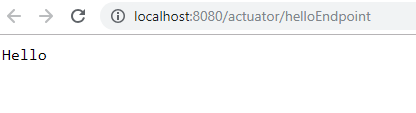
Creating a Custom Actuator Endpoint
To customize the endpoint and define your own endpoint, simply Create a classs annotate with @Endpoint URL :
import org.springframework.boot.actuate.endpoint.annotation.Endpoint;
import org.springframework.boot.actuate.endpoint.annotation.ReadOperation;
import org.springframework.stereotype.Component;

@Endpoint(id="helloEndpoint")
@Component
public class ListEndPoints {
    @ReadOperation
    public String mypoint(){
        return "Hello" ;
    }
}
Few more Endpoints
-
env – Displays current environment information
-
flyway – Shows Flyway database migrations details
-
liquidbase – Shows details of liquibase database migrations
-
shutdown – Allows to shut down the application gracefully
-
mappings– Displays a list of all @RequestMapping paths
-
scheduledtasks – Displays the scheduled tasks in the application
-
threaddump – Performs a thread dump
-
headdump – Returns JVM head dump