Sleuth and Zipkin
Distributed Tracing with Spring Cloud Sleuth(Sluuth) and Zipkin
In the microservices world, a user action on UI may invoke one microservice API endpoint, which in turn invoke another microservice endpoint.
For example, when a user sees the catalog, shoppingcart-ui will invoke catalog-service REST API http://localhost:8181/api/products which in turn calls inventory-service REST API http://localhost:8282/api/inventory to check for inventory availability.
Suppose, an exception has occurred or the data returned is invalid and you want to investigate what is wrong by looking at logs. But as of now, there is no way to correlate the logs of that particular user across multiple services.
Olden Days
One solution to this is at the beginning of the call chain we can create a CORRELATION_ID and add it to all log statements. Along with it, send CORRELATION_ID as a header to all the downstream services as well so that those downstream services also use CORRELATION_ID in logs. This way we can identify all the log statements related to a particular action across services.
We can implement this solution using MDC feature of Logging frameworks. Typically we will have a WebRequest Interceptor where you can check whether there is a CORRELATION_ID header. If there is no CORRELATION_ID in the header then create a new one and set it in MDC. The logging frameworks include the information set in MDC with all log statements.
But, instead of we doing all this work we can use Spring Cloud Sleuth which will do all this and much more for us.
Using Sleuth
Add Sleuth Dependecy in All Microservices (EDC, MI)
<dependency\>
	<groupId>org.springframework.cloud</groupId>
	<artifactId>spring-cloud-starter-sleuth</artifactId>
	<version>2.2.8.RELEASE</version>
</dependency>
Once you add Sleuth starter and start the services you can observe in logs something like this.
2018-03-20 10:19:15.512 INFO [inventory-service,,,] 53685 --- [trap-executor-0]
c.n.d.s.r.aws.ConfigClusterResolver ...

2018-03-20 10:24:15.507 INFO [inventory-service,,,] 53685 --- [trap-executor-0]
c.n.d.s.r.aws.ConfigClusterResolver ...
Now hit any inventory-service REST endpoint, say http://localhost:8282/api/inventory. Then you can observe TraceID, SpanID in the logs.
2018-03-20 10:15:38.466 INFO [inventory-service,683f8e4370413032,d8abe400c68a9a6b,false] 53685 — [oryController-3] …
Sleuth includes the pattern [appname,traceId,spanId,exportable] in logs from the MDC.
Now invoke the catalog-service endpoint http://localhost:8181/api/products endpoint which internally invokes inventory-service endpoint http://localhost:8282/api/inventory .
In catalog-service logs you can find log statements something like:
2018-03-20 10:54:29.625 INFO [catalog-service,0335da07260d3d6f,0335da07260d3d6f,false] 53617 --- [io-8181-exec-10] ...
And, check logs in inventory-service, you can find log statements something like:
2018-03-20 10:54:29.662 INFO [inventory-service,0335da07260d3d6f,1af68249ac3a6902,false] 53685 --- [oryController-6] ...
Observe that TraceID 0335da07260d3d6f is same in both catalog-service and inventory-service for the same REST API call. This way we can easily correlate the logs across services.
The false in [inventory-service,0335da07260d3d6f,1af68249ac3a6902,false] indicates that this trace is not exported to any Tracing Server like Zipkin. Let us see how we can export the tracing information to Zipkin.
Zipkin – Distributed Tracing Configuration
Zipkin is a distributed tracing system. It helps gather timing data needed to troubleshoot latency problems in service architectures. Features include both the collection and lookup of this data.
If you have a traceID in a log file, you can jump directly to it. Otherwise, you can query based on attributes such as service, operation name, tags and duration. Some interesting data will be summarized for you, such as the percentage of time spent in a service, and whether or not operations failed.
The quick and easiest way to start a Zipkin server is using zipkin executable jar provided by Zipkin team.
-
Download Jar file : https://zipkin.io/pages/quickstart.html
-
Run Server : java -jar zipkin.jar
-
Access using : http://127.0.0.1:9411/
We observed that the tracing information is printed in logs but not exported. We can export them to Zipkin server so that we can visualize traces in Zipkin Server UI Dashboard.
Add Zipkin Client starter to both inventory-service and catalog-service.
<dependency>
	<groupId>org.springframework.cloud</groupId>
	<artifactId>spring-cloud-starter-zipkin</artifactId>
	<version>2.2.8.RELEASE</version>
</dependency>
Configure Zipkin server URL in application.properties of both inventory-service and catalog-service.
spring.zipkin.base-url=http://localhost:9411/
spring.sleuth.sampler.probability=1
Now restart both inventory-service and catalog-service and invoke http://localhost:8181/api/products endpoint. You can observe that true is printed in logs meaning it is exported.
2018-03-20 11:41:02.241 INFO [catalog-service,7d0d44fe314d7758,7d0d44fe314d7758,true] 53617 --- [nio-8181-exec-5] c.s.c.services.ProductService
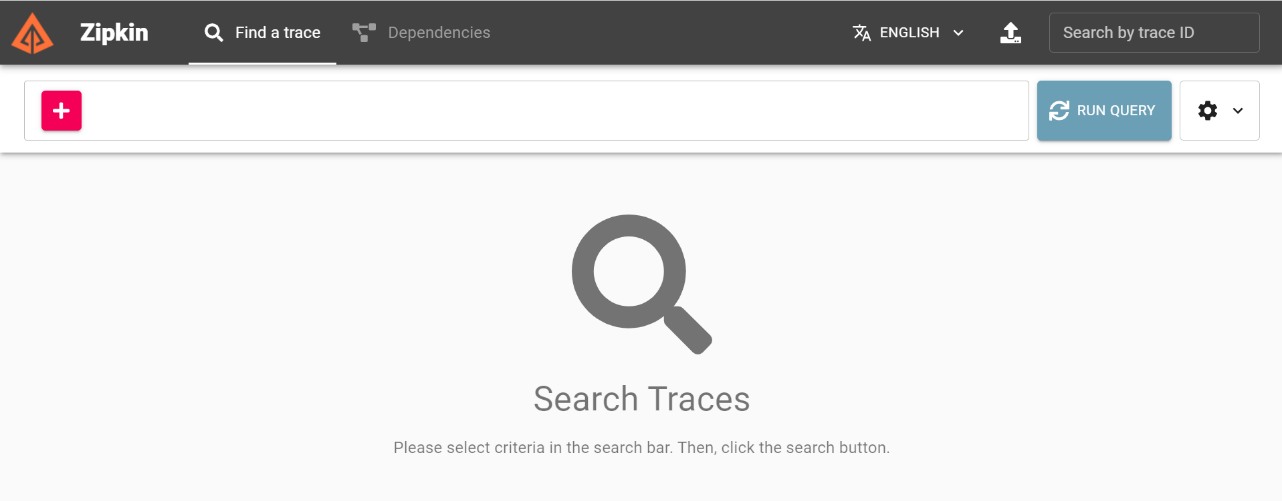
Now go to Zipkin UI Dashboard, you can see the service names populated in the first dropdown. Select the service you want to check or select all and then click on Find Traces button.